Analogous to CIE Ra (CRI). Characterizes the average color shift of the 99 CES to characterize the overall level of similarity betweenGamut Index Rg
the test source and reference illuminant. Values range from 0 to 100, with 100 being maximum fidelity.
Compares the area enclosed by the average chromaticity coordinates in each of 16 hue bins to characterize the average saturation level of the test source compared to the reference illuminant. A neutral score is 100, with values greater than 100 indicating an increase in saturation and values less than 100 indicating a decrease in saturation. The range in values grows as fidelity decreases.
Correlated Color Temperature CCT
This is the temperature in degrees Kelvin of the black body radiator that has the closest color in the (obsolete) perceptual CIE 1960 UCS. This is used in TMS-30-15 to determine the color temperature of the reference Black Body or Daylight illuminant. A Black Body reference is used up to 4500K, and a Daylight reference is used above 5500K, with a blended reference used between these two color temperatures.
Delta u,v Duv
This is the distance in CIE 1960 UCS uv value ("Duv") from the chomaticity of the reference illuminant to the measured sample. A tolerance of 0.0054 Duv is regarded as satisfactory in many lighting standards, corresponding to roughly 7-8 CIEDE2000 (Note that the MacAdam Ellipse "step" number correlates with the Delta E 2000. This is not a coincidence.) A positive value indicates that the measurement is above the black body locus (green direction), while a negative value is below it (purple direction). Note that this value will differ to that returned in traditional Correlated Color Temperature measurement, due to the latter being a distance to the Black Body locus rather than blended Black Body & Daylight locus.
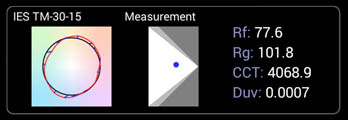
The leftmost graphic plot illustrates the relative fidelity and
gamut difference between the reference illuminant and the one
being measured.
The black circle represents the reference illuminant colors of 16
bins of samples, ordered by hue around the circle.
The Red curve represents the values of those sample bins under the
measured illuminant. The red curve will lie outside the black
circle when the illuminant makes those color bins look more
colorful, and lie inside the black circle when those color bins
look less colorful. The distance between the black circle and the
red curve shows the departure from fidelity of binned sample
colors.
The blue lines show the shift of the color bins under the measured
illuminant, illustrating both the change in saturation as well as
the change in hue.
The center graphic plot illustrates the trade-off between
fidelity and saturation, with Rf plotted on the horizontal axis in
the range 50 - 100, and Rg plotted on the vertical axis in the
range 60 to 140 with 100 at the center. The white triangle
represents the possible values of light sources that are on the
blackbody locus, while the slightly larger area bounded by darker
grey shows the Rg/Rf combinations from any possible light sources.
For more information about TM-30-15, please consult the IES website.